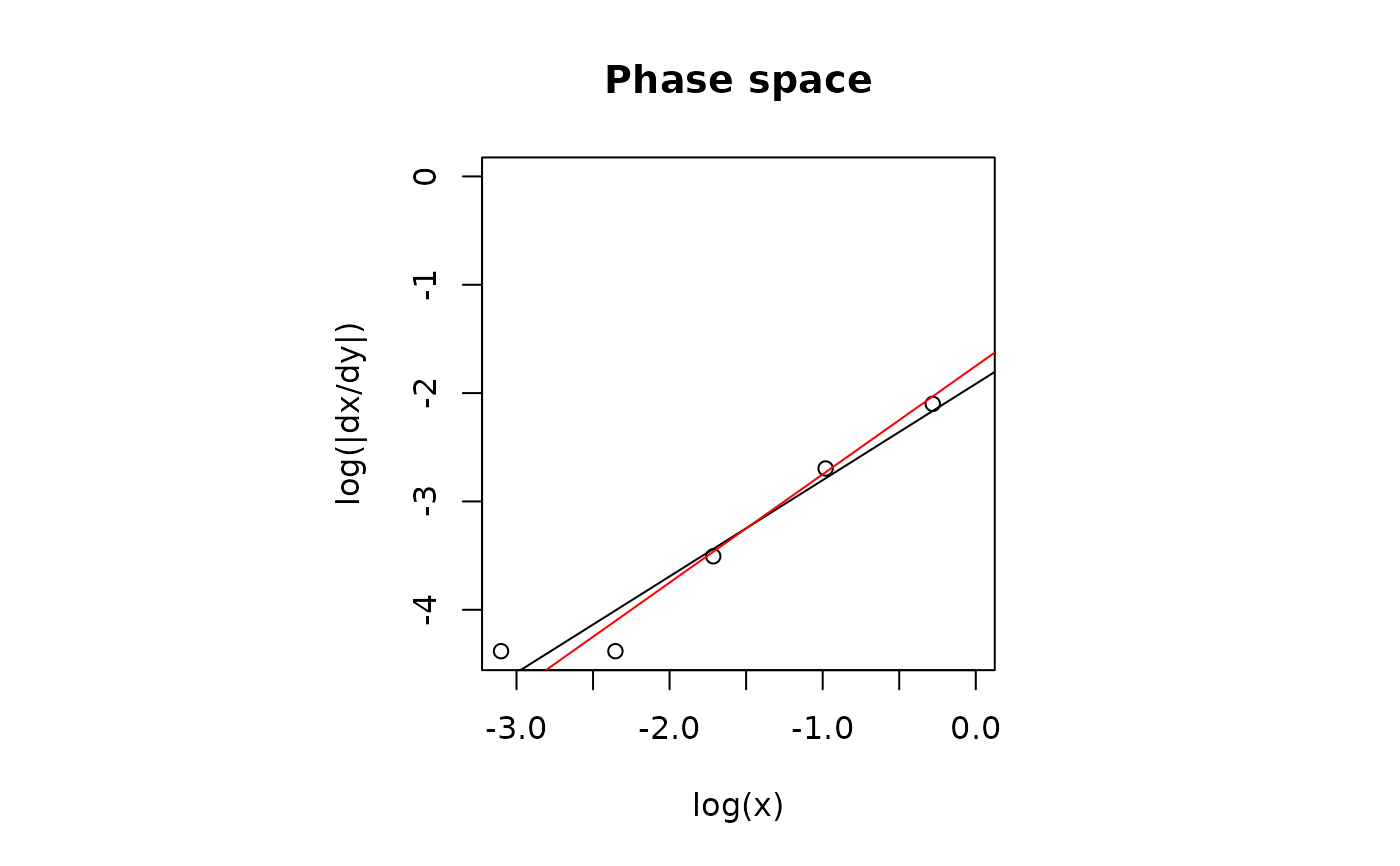
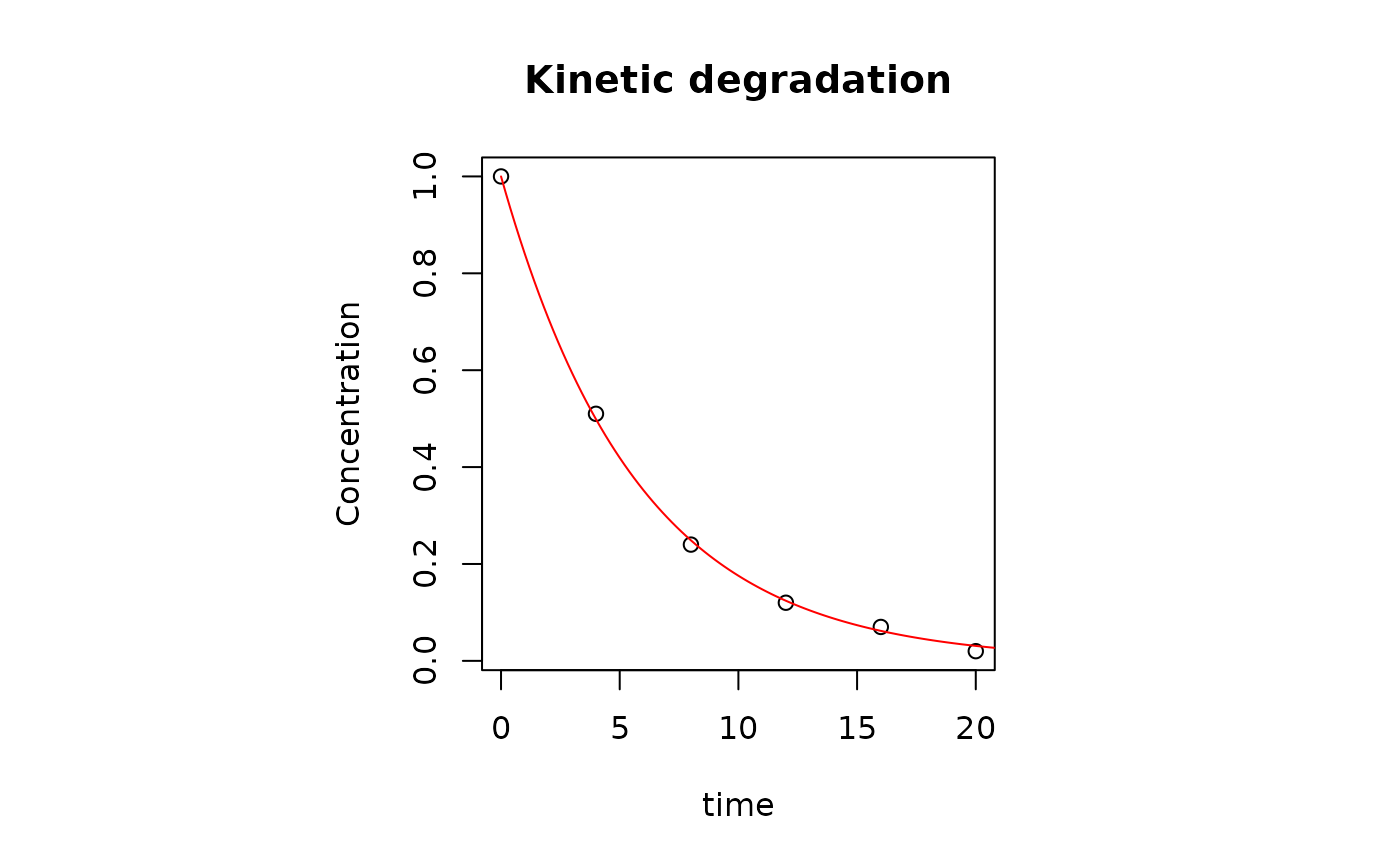
The function plots the results obtained from a det_order() function.
Two plots are shown: one representing the transformed data in the phase
space and the other the kinetic data in the conventional space along with
their regression curves.
Value
Two plots. The first representing the transformed data in the phase space and the other the kinetic data in the conventional space along with their regression curves. Black line represent the best regression curve, whereas green lines show the fits with the reaction order chosen.
Examples
t <- c(0, 4, 8, 12, 16, 20)
conc <- c(1, 0.51, 0.24, 0.12, 0.07, 0.02)
dframe <- data.frame(t, conc)
res <- det_order(dframe)
#> Reaction order estimated: 1

plot_ord(res)